Water usage efficiency has been a significant topic of concern globally as the world faces numerous environmental and resource-related challenges. With an increasing population and higher demands for water, understanding the trends in water usage efficiency from 2000 to 2023 provides critical insights. This analysis is not only relevant for environmental scientists but also for IELTS examinees preparing for Writing Task 1. Let’s delve into how this topic can be structured into an IELTS Task 1 essay, and explore vocabulary and grammar tools to handle this theme effectively.
Nội dung bài viết
- Examining the Topic: Trends in Water Usage Efficiency
- Overview and Task Analysis
- Visual Representation: Creating a Graph
- [Insert Line Graph Here]
- Detailed Analysis of the Task
- Understanding the Graph
- Writing the Essay
- Introduction
- Overview
- Body Paragraphs
- Sample Essay
- Important Considerations for IELTS Writing Task 1
- Vocabulary and Grammar Tips
- Vocabulary to Remember
- Conclusion
Examining the Topic: Trends in Water Usage Efficiency
Overview and Task Analysis
In the IELTS Writing Task 1, candidates are often asked to interpret data and describe trends. A typical task on water usage efficiency might involve a line graph, bar chart, or table documenting water usage over the years across different sectors like agriculture, industry, and domestic use. Here are three potential IELTS Writing Task 1 prompts related to this topic:
- The graph below shows water usage efficiency in various sectors between 2000 and 2023. Summarize the information by selecting and reporting the main features, and make comparisons where relevant.
- The table below illustrates the changes in water consumption and water-saving initiatives from 2000 to 2023. Summarize the information by selecting and reporting the main features, and make comparisons where relevant.
- The line graph below presents the trends in water usage efficiency in urban and rural areas from 2000 to 2023. Summarize the information by selecting and reporting the main features, and make comparisons where relevant.
For this lesson, let’s select the first prompt which involves a graph.
Visual Representation: Creating a Graph
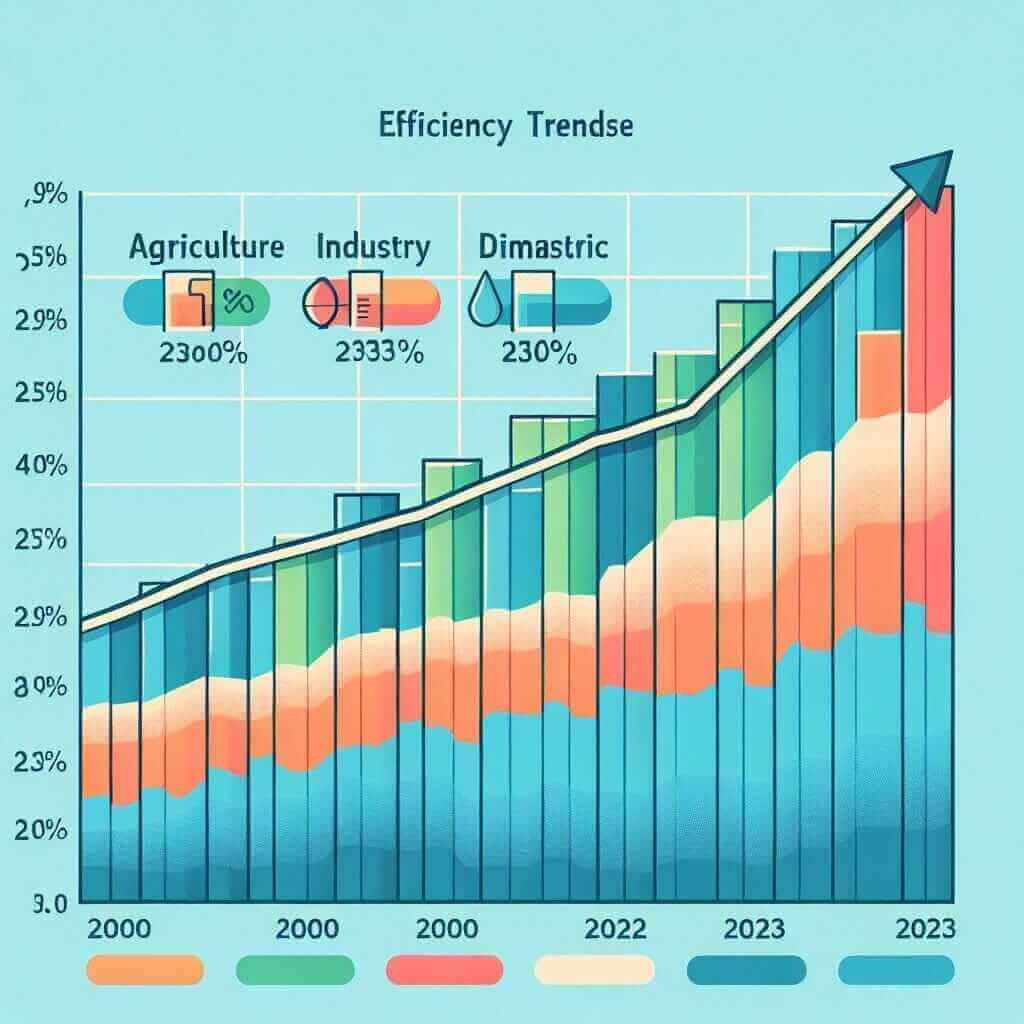
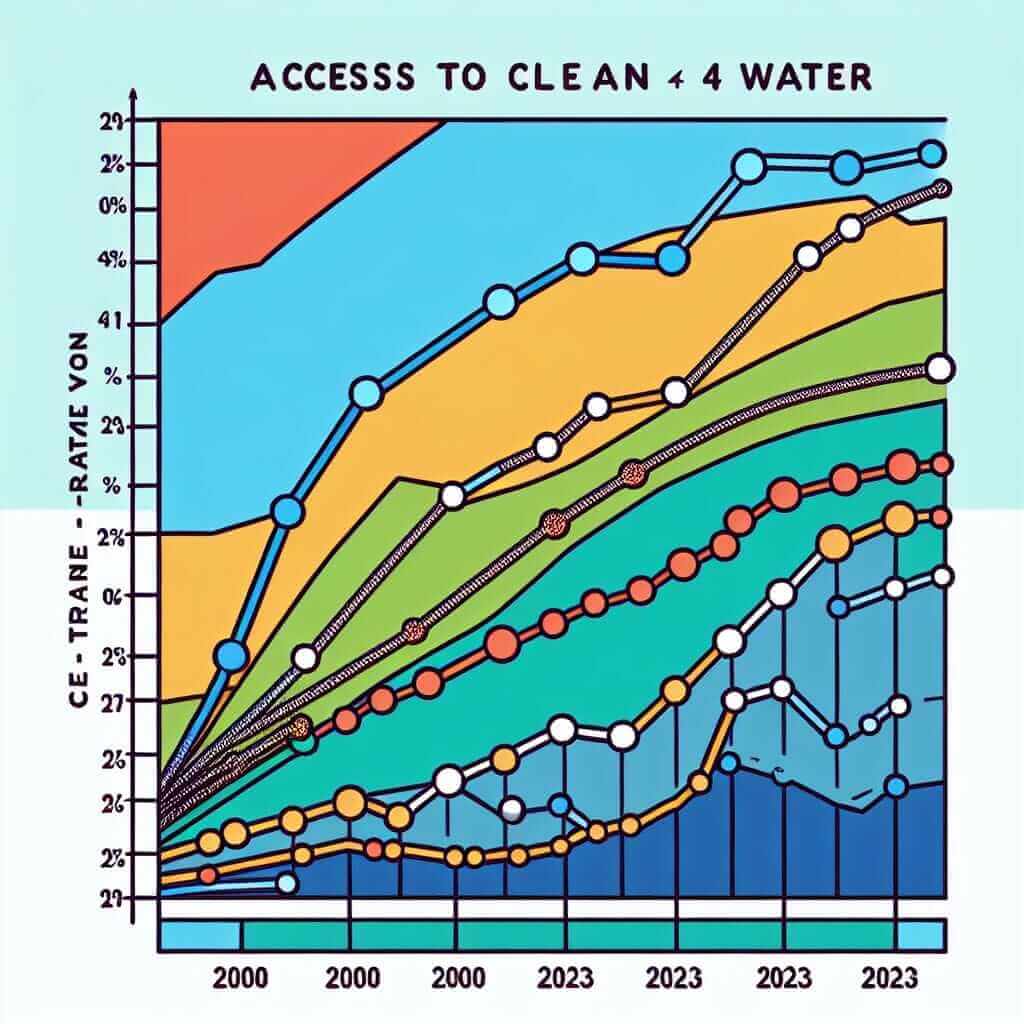
To better understand the trends, I have created a hypothetical line graph representing water usage efficiency (%) in agriculture, industrial, and domestic sectors from 2000 to 2023.
[Insert Line Graph Here]
 Water Usage Efficiency Trends 2000-2023
Figure 1: Trends in Water Usage Efficiency across Agriculture, Industrial, and Domestic Sectors (2000-2023)
Detailed Analysis of the Task
Understanding the Graph
- Identify Key Trends: Look at the overall upward or downward trends.
- Highlight Significant Data Points: Note any peaks, troughs, or plateaus.
- Comparison: Compare the efficiency trends across different sectors.
- Time Frame: Focus on changes over specific periods for detailed analysis.
Writing the Essay
Introduction
Begin by paraphrasing the prompt:
The line graph illustrates the changes in water usage efficiency in the agriculture, industry, and domestic sectors from 2000 to 2023.
Overview
Provide a summary of the key trends observed:
Overall, there has been a marked improvement in water usage efficiency across all sectors over the 23-year period, with the industrial sector showing the most significant increase.
Body Paragraphs
Use the following outline:
-
Body Paragraph 1:
- Discuss the trend in the agricultural sector.
- Mention the starting and ending points, and any major fluctuations.
-
Body Paragraph 2:
- Analyze the trend in the industrial sector.
- Highlight the rate of increase and any notable changes.
-
Body Paragraph 3:
- Describe the trend in the domestic sector.
- Compare the efficiency growth with the other sectors.
Sample Essay
The line graph elucidates the trends in water usage efficiency in agricultural, industrial, and domestic sectors from 2000 to 2023.
Overall, all three sectors have witnessed an enhancement in water usage efficiency over the given period, with the industrial sector exhibiting the most pronounced improvement.
In 2000, the agriculture sector had a water usage efficiency of about 30%. This figure showed a gradual increase, reaching approximately 50% by 2010. However, there was a period of stagnation between 2010 and 2015. Post-2015, the efficiency continued to rise steadily, culminating at around 70% by 2023.
The industrial sector began with the lowest efficiency of 20% in 2000. A rapid increase was observed, particularly between 2005 and 2015, where efficiency doubled from 30% to 60%. By 2023, the industrial sector reached the highest efficiency of the three sectors, at nearly 80%.
The domestic sector’s efficiency improvements were more modest compared to the other sectors. Starting at 40% in 2000, the efficiency gradually increased, hitting a peak of 60% in 2023. The trajectory was relatively linear, with no significant deviations.
To sum up, while all sectors showed improvements in water usage efficiency from 2000 to 2023, the most substantial growth was seen in the industrial sector.
Word Count: 223 words
Important Considerations for IELTS Writing Task 1
Vocabulary and Grammar Tips
-
Use Comparative Structures:
- “While…, …”
- “Compared to…, …”
- “In contrast,…”
-
Employ Specific Vocabulary:
- Efficiency [ɪˈfɪʃ(ə)nsi] (n.)
- Agriculture [ˈæɡrɪˌkʌltʃər] (n.)
- Industry [ˈɪndəstri] (n.)
- Domestic [dəˈmɛstɪk] (adj.)
- Significant [sɪɡˈnɪfɪkənt] (adj.)
- Plateau [plæˈtoʊ] (n./v.)
-
Sentence Variety:
- Use a mixture of complex and simple sentences to enhance readability and coherence.
Vocabulary to Remember
- Efficiency [ɪˈfɪʃ(ə)nsi] (n.) – The ability to accomplish a job with a minimum expenditure of time and effort.
- Agriculture [ˈæɡrɪˌkʌltʃər] (n.) – The science or practice of farming.
- Industry [ˈɪndəstri] (n.) – Economic activity concerned with the processing of raw materials and manufacturing of goods.
- Domestic [dəˈmɛstɪk] (adj.) – Pertaining to the home or household.
- Significant [sɪɡˈnɪfɪkənt] (adj.) – Having notable importance.
- Plateau [plæˈtoʊ] (n./v.) – A state of little or no change following periods of activity or progress.
Conclusion
Understanding how to interpret and describe trends in water usage efficiency is vital for scoring well in the IELTS Writing Task 1. This involves analyzing data, comparing different sectors, and clearly articulating observations. Practice drafting essays on similar topics to enhance your skills, aiming for clarity, coherence, and logical progression to achieve Band 7+ scores.


