Understanding Pie Charts in IELTS Writing Task 1
Pie charts are a common visual representation in IELTS Writing Task 1. They display data as slices of a circular “pie,” with each slice representing a percentage of the whole. Understanding how to interpret and describe pie charts is crucial for achieving a high score in this section of the IELTS exam.
Nội dung bài viết
- Understanding Pie Charts in IELTS Writing Task 1
- Key Features of Pie Charts
- Analyzing Pie Chart Data
- 1. Identify the Topic and Time Frame
- 2. Recognize the Main Categories
- 3. Note Percentages and Proportions
- 4. Identify Significant Patterns or Trends
- Writing Your Response
- 1. Introduction
- 2. Overview
- 3. Detailed Description
- 4. Comparisons and Contrasts
- Common Pitfalls to Avoid
- Practice and Improvement Strategies
Key Features of Pie Charts
- Circular shape
- Divided into sectors or slices
- Each slice represents a category
- Size of each slice corresponds to its percentage of the total
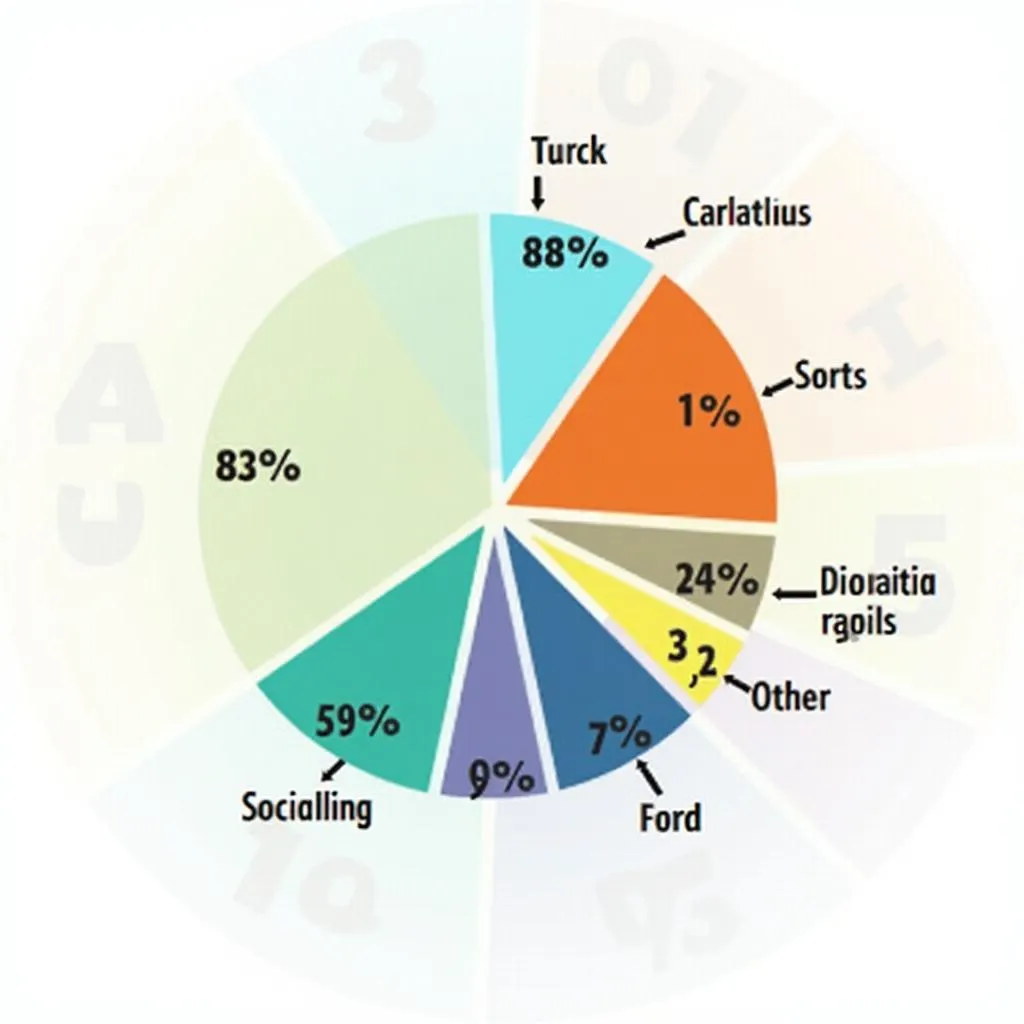
 Example of IELTS pie chart showing key features
Analyzing Pie Chart Data
When faced with a pie chart in IELTS Writing Task 1, follow these steps to analyze the data effectively:
1. Identify the Topic and Time Frame
Start by carefully reading the title and any accompanying information. This will give you context about what the pie chart represents and whether it shows data for a specific time period or compares different times.
2. Recognize the Main Categories
Examine the legend or labels to understand what each slice of the pie represents. Typically, pie charts in IELTS will have 4-6 main categories.
3. Note Percentages and Proportions
Look at the size of each slice and the corresponding percentages. Identify the largest and smallest categories, as well as any that are similar in size.
4. Identify Significant Patterns or Trends
Observe if there are any notable patterns, such as one category dominating the chart or several categories having similar percentages.
Writing Your Response
When writing about pie charts in IELTS Task 1, structure your response as follows:
1. Introduction
Begin with a concise introduction that paraphrases the information given in the question. For example:
“The pie chart illustrates the distribution of leisure activities among adults in a typical week.”
2. Overview
Provide a general summary of the main features of the chart. This is crucial for achieving a higher band score. For instance:
“Overall, it is clear that watching television is the most popular leisure activity, while reading occupies the least amount of adults’ free time.”
3. Detailed Description
Divide the pie chart into logical groups and describe them in detail. Use precise language and appropriate linking words. For example:
“The chart shows that watching television dominates leisure time, accounting for 40% of adults’ free time activities. This is followed by socializing, which takes up a quarter (25%) of leisure time.
Sports and exercise make up the third largest category, representing 20% of free time. In contrast, reading is the least popular activity, with only 5% of adults’ leisure time devoted to this pursuit. The remaining 10% is attributed to other unspecified activities.”
4. Comparisons and Contrasts
Make meaningful comparisons between different categories. For instance:
“Interestingly, adults spend eight times more of their leisure time watching television than reading. Moreover, the combined percentage for active pursuits (sports and socializing) is slightly higher than the passive activity of TV watching, at 45% compared to 40%.”
 IELTS Writing Task 1 pie chart sample response
Common Pitfalls to Avoid
When describing pie charts in IELTS Writing Task 1, be aware of these common mistakes:
- Failing to provide an overview
- Merely listing percentages without analysis or comparison
- Using informal language or personal opinions
- Neglecting to group similar categories together
- Overcomplicating simple data
Practice and Improvement Strategies
To excel in describing pie charts for IELTS Writing Task 1:
- Practice with a variety of pie chart examples
- Time yourself to ensure you can complete the task within 20 minutes
- Use a range of vocabulary for describing proportions and percentages
- Review sample answers and examiner comments to understand scoring criteria
- Seek feedback from a qualified IELTS instructor or study group
By following this guide and practicing regularly, you’ll be well-prepared to tackle pie charts in IELTS Writing Task 1 with confidence and precision.


