The topic of “Global Shipping Emissions” has become increasingly prevalent in recent years, reflecting the growing concern about the environmental impact of international trade. As such, it’s no surprise that this topic may appear in the IELTS Writing Task 1 exam. Understanding how to effectively describe and analyze data related to this topic is crucial for achieving a high band score.
Nội dung bài viết
Here are some potential IELTS Writing Task 1 questions related to this theme:
- The line graph below shows the changes in global shipping emissions from 2000 to 2020. Summarise the information by selecting and reporting the main features, and make comparisons where relevant.
- The table illustrates the percentage contribution of different ship types to global shipping emissions in 2023. Summarise the information by selecting and reporting the main features, and make comparisons where relevant.
- The chart compares the projected growth in shipping emissions with the International Maritime Organization’s (IMO) targets for emissions reduction. Summarise the information by selecting and reporting the main features, and make comparisons where relevant.
Sample IELTS Writing Task 1 Question and Model Answer
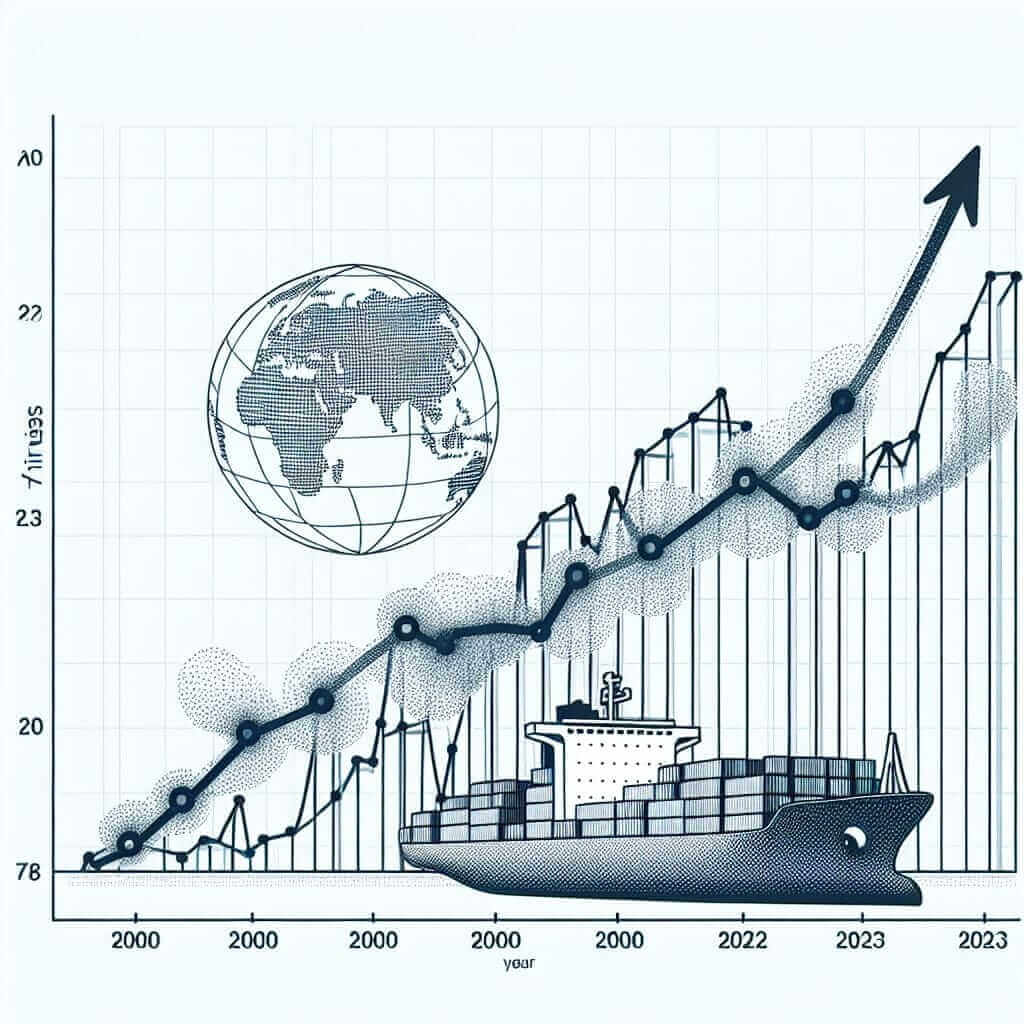
The line graph below shows the total greenhouse gas emissions (in millions of tonnes) from global shipping between 2000 and 2023.
(Insert a line graph here with the x-axis showing the years 2000-2023 and the y-axis showing emissions in millions of tonnes. The data should show a general upward trend with some fluctuations.)
 Global Shipping Emissions 2000-2023
Summarise the information by selecting and reporting the main features, and make comparisons where relevant.
Analysis of the Task
This task requires you to describe a line graph that presents data over time. Key points to remember:
- Overview: Provide a general overview of the trend shown in the graph.
- Key Features: Identify and describe the most significant changes, such as peaks, troughs, and periods of stability or rapid change.
- Comparisons: Where relevant, compare the data points at different time periods.
- Data Accuracy: Ensure you are accurately reading and representing the data from the graph.
- Language: Use appropriate vocabulary for describing trends (e.g., increase, decrease, fluctuate, plateau) and making comparisons (e.g., higher than, lower than, similar to).
Model Answer
The line graph illustrates the trend in greenhouse gas emissions from global shipping activities between 2000 and 2023. Overall, the data reveals a concerning increase in emissions over the period, albeit with some notable fluctuations.
At the start of the period, in 2000, shipping emissions stood at approximately 800 million tonnes. This figure rose steadily over the next five years, reaching a peak of 950 million tonnes in 2005. Following this, there was a slight dip in emissions, coinciding with the global economic downturn, before resuming an upward trajectory.
Between 2010 and 2018, emissions remained relatively stable, hovering around the 900 million tonne mark. However, from 2019 onwards, there was a sharp spike in emissions, culminating in a new high of 1100 million tonnes in 2023.
In conclusion, despite some periods of relative stability and minor fluctuations, the overall trend depicted in the graph is one of significant growth in greenhouse gas emissions from global shipping over the 23-year period. (Word Count: 165 words)
Notes on Vocabulary and Grammar
- Vocabulary: The model answer uses precise vocabulary to describe trends (e.g., “rose steadily,” “slight dip,” “upward trajectory,” “sharp spike”) and make comparisons (e.g., “higher than,” “lower than”).
- Grammar:
- Present tense is used to describe the graph and the trends.
- Past tense is used to describe specific data points in the past.
- A variety of sentence structures are used to avoid repetition.
Difficult Vocabulary
- Greenhouse Gas Emissions (noun phrase): /ˈɡriːnhaʊs ˌɡæs iˈmɪʃənz/ – Gases released into the atmosphere, primarily from burning fossil fuels, that trap heat and contribute to global warming.
- Fluctuation (noun): /ˌflʌktʃuˈeɪʃən/ – An irregular rising and falling in number or amount; a variation.
- Economic Downturn (noun phrase): /ˌiːkəˈnɒmɪk ˈdaʊntɜːn/ – A period of decline in economic activity.
- Trajectory (noun): /trəˈdʒektəri/ – The path followed by a projectile flying or an object moving under the action of given forces.
- Spike (noun): /spaɪk/ – A sudden, sharp increase in something.
- Culminating (verb): /ˈkʌlmɪneɪtɪŋ/ – Reach a climax or point of highest development.
Conclusion
Mastering the skills to describe and analyze data related to global issues like shipping emissions is essential for success in IELTS Writing Task 1. By understanding the key features of the data, using precise vocabulary, and employing correct grammar, you can write a clear, concise, and informative report that will help you achieve a Band 7+ score. Remember to practice regularly using a variety of data sets to improve your skills and confidence.


