The IELTS Writing Task 1 often presents candidates with charts, graphs, or tables depicting various trends. “Electricity Demand Fluctuations” is a topic that can appear in various forms, requiring you to showcase your data interpretation and language skills. This article will equip you with the necessary tools to tackle this topic effectively, aiming for a Band 7+ score.
Nội dung bài viết
Understanding the Topic and Potential Questions
Before diving into data analysis, it’s crucial to comprehend the scope of “Electricity Demand Fluctuations (2000-2023).” This topic might involve:
- Seasonal variations: Analyzing peak and off-peak electricity consumption patterns throughout a year.
- Long-term trends: Examining the overall increase or decrease in electricity demand over two decades.
- Factors influencing fluctuations: Identifying reasons behind specific peaks or dips in electricity usage.
Potential IELTS Writing Task 1 questions could be:
- The provided graph illustrates the monthly fluctuations in electricity demand in a metropolitan city from 2000 to 2023. Summarize the information by selecting and reporting the main features and make comparisons where relevant.
- The table below shows the electricity consumption in different sectors (residential, industrial, commercial) in a country between 2000 and 2023. Write a report describing the trends and any significant changes.
- The chart displays the impact of key events on electricity demand in a specific region between 2000 and 2023. Analyze the data and provide a well-structured report.
Sample Task and Model Answer
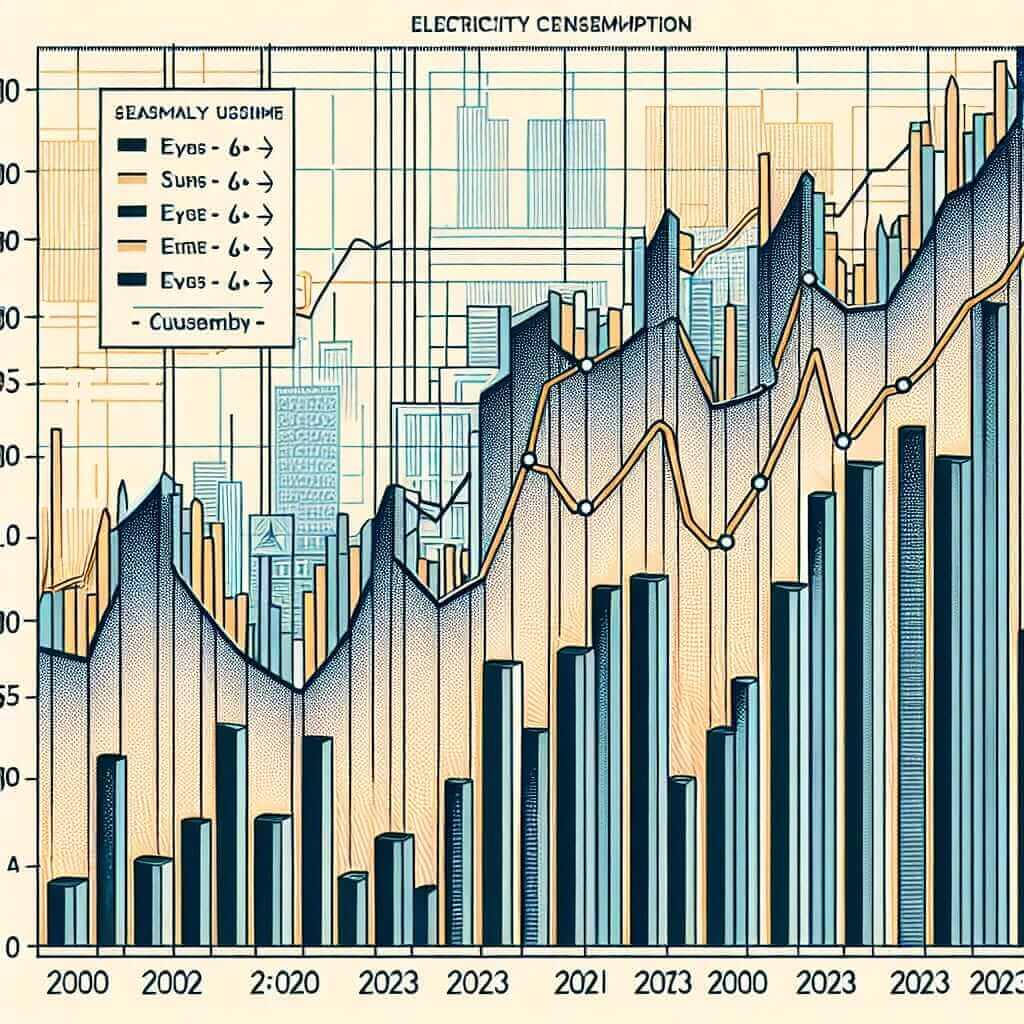
Let’s focus on the first question about monthly electricity demand fluctuations in a metropolitan city. Imagine the following line graph depicting the data:
 Electricity Demand Fluctuations in a Metropolitan City (2000-2023)
Analyzing the Task
The task instructs us to:
- Summarize information: Provide a concise overview of the main trends.
- Select and report main features: Identify and describe the most significant patterns.
- Make comparisons: Highlight any notable differences or similarities.
Model Answer
The line graph depicts the monthly fluctuations in electricity demand for a metropolitan city over a 23-year period, from 2000 to 2023.
Overall, electricity demand shows a cyclical pattern with predictable peaks and troughs coinciding with seasonal changes. The highest demand consistently occurs during the summer months of June, July, and August, likely driven by increased air conditioning usage. Conversely, the lowest demand is observed during the winter months of December, January, and February, reflecting lower cooling requirements.
Looking at the long-term trend, there is a noticeable upward trajectory in electricity consumption. This indicates a steady increase in overall demand, possibly attributed to population growth, urbanization, and the proliferation of electronic devices.
Furthermore, the difference between peak summer demand and trough winter demand has widened over the years. This suggests that seasonal variations are becoming more pronounced, emphasizing the growing influence of temperature on electricity consumption patterns.
(Word count: 160)
Writing Tips
- Paraphrase the question: Avoid simply copying the question prompt. Use synonyms and rephrase to demonstrate vocabulary strength.
- Overview: Start with a general statement summarizing the main trend observed in the data.
- Group data effectively: Identify patterns and group data logically, like comparing seasonal variations or highlighting significant differences between years.
- Use linking words: Ensure a smooth flow of information using appropriate linking words and phrases like “however,” “furthermore,” “in contrast,” etc.
- Be accurate and specific: Use precise language and data from the graph to support your statements. Avoid generalizations.
Vocabulary Focus
- Fluctuations (noun /ˌflʌktʃuˈeɪʃənz/): irregular rising and falling in number or amount; variations.
- Metropolitan (adjective /ˌmɛtrəˈpɒlɪtən/): relating to a large city, typically the most important city in a large area.
- Cyclical (adjective /ˈsaɪklɪkl/): occurring in cycles; regularly repeated.
- Troughs (noun /trɔːz/): the lowest points on a graph representing data.
- Trajectory (noun /trəˈdʒɛktəri/): the path followed by a projectile flying or an object moving under the action of given forces.
- Proliferation (noun /prəˌlɪfəˈreɪʃn/): rapid increase in numbers.
- Pronounced (adjective /prəˈnaʊnst/): very noticeable or marked; conspicuous.
Conclusion
Mastering the IELTS Writing Task 1 requires a combination of analytical and language skills. By understanding the nuances of data interpretation, employing relevant vocabulary, and following a structured approach, you can confidently tackle any graph or chart related to “Electricity Demand Fluctuations (2000-2023)” and achieve your desired band score. Remember to practice regularly and familiarize yourself with various question types to excel in this section of the IELTS exam.


