The Importance of IELTS Writing Task 1
The IELTS Writing Task 1 is designed to assess your ability to analyze and report visual data presented in various formats like graphs, charts, tables, diagrams, and maps. A strong performance in this section is crucial for achieving a high overall IELTS Writing band score. This guide will provide a comprehensive, step-by-step process to help you confidently tackle any Writing Task 1 question.
Understanding the Task
Before diving into the writing process, it’s essential to understand the task requirements fully:
1. Time Management: You have 20 minutes allocated for Task 1.
2. Word Count: Aim for a minimum of 150 words.
3. Task Objective: Summarize the key features of the given visual data objectively, using your own words.
4. Formal Tone: Maintain a formal and neutral tone throughout your response.
The 4-Step Process to Write an Effective IELTS Writing Task 1 Essay
Here’s a proven 4-step approach to help you craft a well-structured and high-scoring IELTS Writing Task 1 essay:
1. Analyze the Visual Data
a) Identify the Type of Visual: Determine whether you are presented with a line graph, bar chart, pie chart, table, diagram, or map.
b) Understand the Axes and Labels: Carefully examine the labels on the axes (if applicable) and the units of measurement used.
c) Determine the Main Trend(s): Identify the most significant changes, patterns, or trends depicted in the visual data.
d) Note Supporting Details: Look for specific data points that support the main trends you’ve identified.
2. Plan Your Response
a) Structure: Organize your essay logically. A common structure includes:
- Introduction: Briefly paraphrase the visual information provided (what does the visual represent?).
- Overview: Summarize the main trends or patterns you identified, without going into specific details.
- Body Paragraphs: Provide a more detailed description of the key features, supporting your points with specific data references from the visual.
b) Vocabulary: Choose appropriate vocabulary to describe trends (increase, decline, fluctuate, etc.), comparisons (higher than, lower than, similar to, etc.), and proportions (one-third, half, the majority, etc.).
3. Write Your Response
- Introduction: Start with a clear and concise paraphrased sentence that introduces the type of visual and the main topic it represents.
- Example: “The line graph illustrates the average monthly temperatures in London, England, over a one-year period.”
- Overview: Present a general overview of the main trends or patterns, avoiding specific numbers.
- Example: “Overall, the graph shows that temperatures in London are highest in the summer months and lowest in the winter months, with a noticeable degree of fluctuation throughout the year.”
- Body Paragraphs: Focus on describing specific details and supporting your statements with data from the visual. Use linking words and phrases to ensure a smooth flow of information.
- Example: “Specifically, the average temperature peaks in July at approximately 22 degrees Celsius, while the lowest average temperature occurs in January at around 5 degrees Celsius. There is a gradual increase in temperature from February to July, followed by a steady decline towards the end of the year.”
4. Review and Edit
- Accuracy: Ensure that you have accurately represented the data from the visual.
- Grammar and Vocabulary: Check for any grammatical errors, subject-verb agreement, correct tense usage, and appropriate vocabulary.
- Coherence and Cohesion: Make sure your essay flows logically and that you have used appropriate linking words and phrases.
- Word Count: Verify that you have met the minimum word count requirement.
Example Task and Response
Let’s look at an example:

Sample Response:
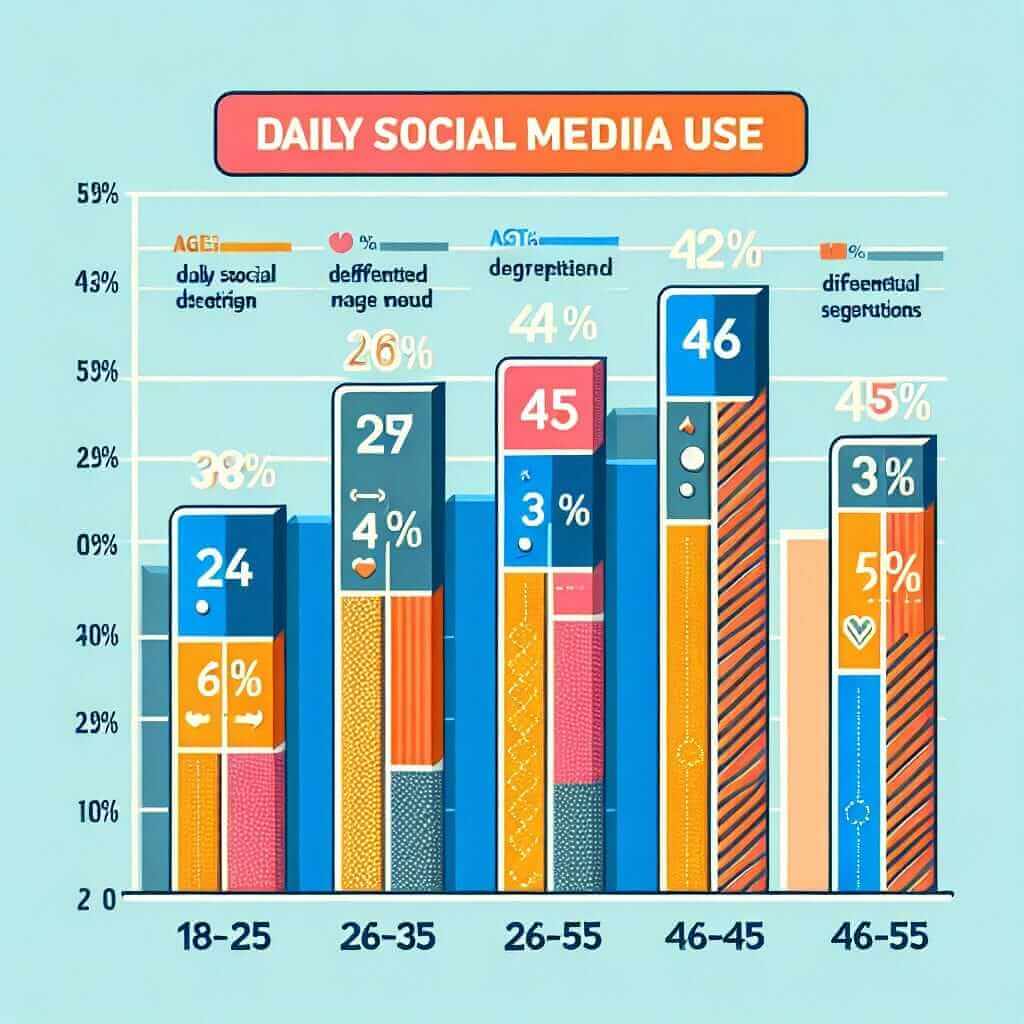
The bar chart illustrates the proportion of individuals across four distinct age groups who engage with social media platforms on a daily basis.
Overall, it is evident that daily social media usage is significantly higher among younger age demographics. While the youngest age group demonstrates the most frequent use, there is a clear downward trend as age increases.
To elaborate, a striking 85% of individuals aged 18-25 report using social media every day. This figure is considerably higher than the 65% recorded for the 26-35 age bracket. The percentage drops further to 40% for those aged 36-45. Notably, only 20% of individuals in the oldest age group (46-55) report engaging with social media daily.
This pattern suggests a strong correlation between age and the likelihood of daily social media use, with younger generations demonstrating a significantly higher level of engagement compared to older demographics.
Tips for Success
- Practice Regularly: Familiarize yourself with different types of visuals and practice writing responses under timed conditions.
- Expand Your Vocabulary: Develop a range of vocabulary related to trends, changes, comparisons, and proportions.
- Focus on Clarity and Accuracy: Prioritize clear and concise language, accurately representing the data presented.
- Seek Feedback: Have a teacher or IELTS tutor review your writing and provide feedback on areas for improvement.
By following this step-by-step process and implementing these tips, you’ll be well-equipped to confidently and successfully tackle the IELTS Writing Task 1 and achieve your target band score.